Photo and video gallery
Here I would like to share some photos and videos of what I consider exciting subjects in my domain of research.
1. Agglomerate growth under 2 extreme regimes
- How? The photo below shows (in blue) a typical DLCA (diffusion-limited cluster aggregation) agglomerate consisting of N_0 primary particles generated by a cluster-cluster approach using FracVAL. The agglomerate is subsequently exposed to a total of 16xN_0 monomers (semi-transparent gray color) which are agglomerated by a monomer-cluster approach similar to the DLA simulations developed by Witten and Sander 1983. The main difference with such works is that here I solved the Langevin equation for determining the trajectories of the particles so the particles’ dynamics may be in the transition from diffusive to ballistic agglomeration regime. The second advantage of solving the Langevin equation is that the dynamics of particles are determined by the thermodynamic properties of the surrounding fluid including its pressure and temperature. So, coming back to the picture below, I used the same pressure (atmospheric) and modeled the agglomeration under what I called flame conditions (temperature of 1700 K) and atmospheric conditions (temperature of 300 K). I also considered a 10 nm diameter and 1 µm for the particle under flame and atmospheric conditions, respectively.
- What? This leads to two clearly different morphologies. Under flame conditions, the resulting aggregate has a much more compact structure while under atmospheric conditions the cluster is more elongated and shows more branches. Also, the atmospheric conditions show a more dendritic agglomerate structure.
- Why? The reason these two morphologies are so different is that under flame conditions the monomer-cluster aggregation takes place in the ballistic regime while under atmospheric conditions this process is diffusion-limited. Under ballistic agglomeration, the monomers tend to penetrate more deeply into the growing cluster and therefore produce more compact structures than the diffusion-limited case. Finally, the determination of the ballistic or diffusion regime is related to the particle’s persistent distance which directly depends on the squared root of the temperature divided by the particle mobility diameter. A larger persistent distance compared to the particle sizes will result in ballistic particle movement while the opposite limit results in diffusive movement.

2. Could van der Waals forces make agglomerates of nanoparticles more compact?
- How? The video below shows the 2d agglomeration of particles whose movements are simulated by solving the Langevin equation. I consider van der Waals attractive potentials and a strong (Lennard-Jones) repulsive potential to avoid unphysical overlapping. I also consider that particles agglomerate upon collisions by adding bonded interactions (because van der Waals potentials are not strong enough to keep them together). This simulation was carried out using the ESPResSo molecular dynamics code.
- What? The video is divided into two parts. In the first part, we observe the dynamics of particles forming agglomerates when sliding on the surface of neighbors is allowed. In the second part, I simulate the dynamics of particles avoiding sliding on the surface of neighbors. When I say “sliding” I mean that a pair of monomers can stay agglomerated (bonded interaction persists) but they can have relative motion or slide on the surface of the neighbor while in the second case, this is forbidden.
- Why? Firstly, the surface interaction of nanoparticles is such a difficult subject to measure experimentally that this is a way to explore what may actually happen when two nanoparticles are agglomerated. Secondly, when sliding is forbidden what happens physically between the particles? I hypothesize this may be explained by mechanical interlocking between monomers or another option may be that the surface rugosity of the particles leads to strong van der Waals attractions that are not captured when we simulate primary particles as smooth spheres. Another possible explanation may be that particles form permanent bonds when they are combined upon agglomeration. Similar observations are discussed in this paper.
3. MCAC simulations of nanoparticle aggregation
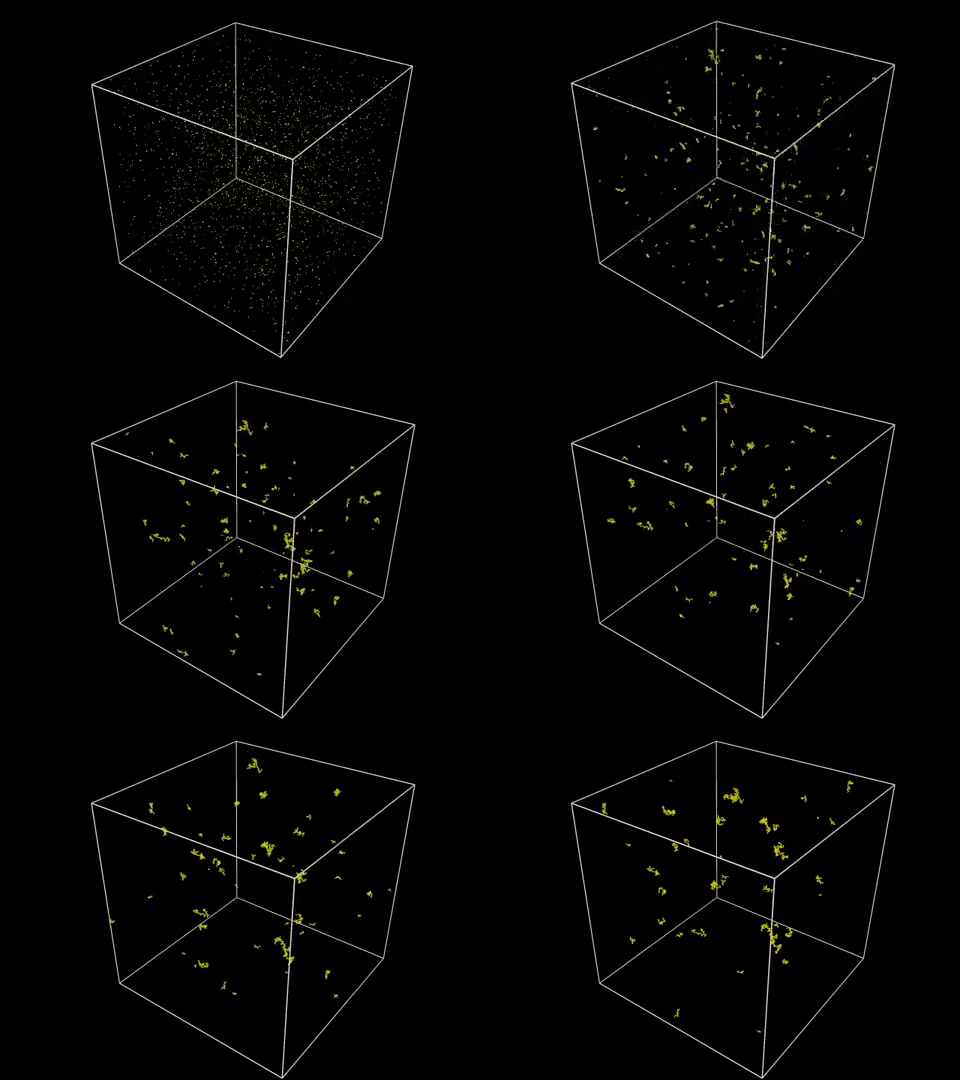
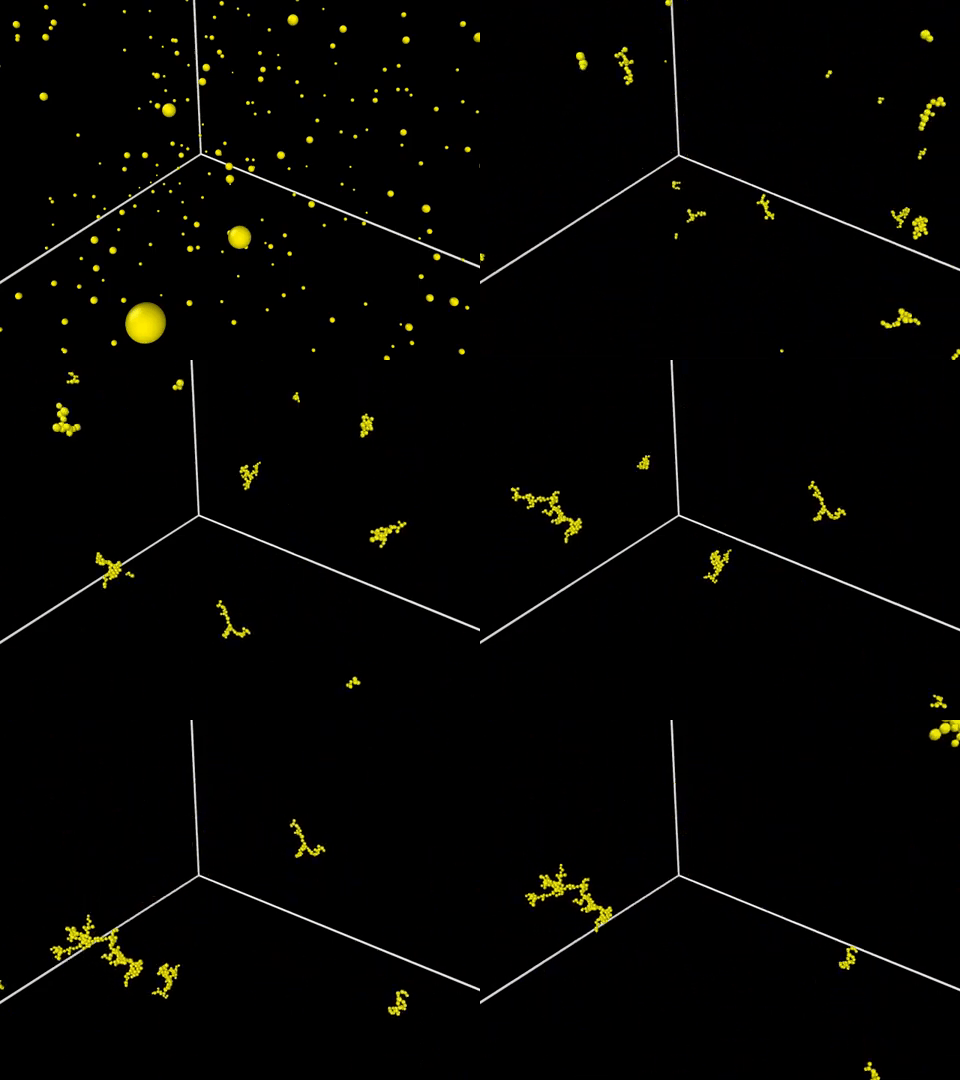
- How? The videos below show animations of MCAC simulations of nanoparticle agglomeration under flame conditions (initially 1024 isolated monomers, at a volume fraction of 100 ppm, a particle diameter of 20 nm). Here the agglomeration is observed for a total of 1.14 ms. Here the particle dynamics is solved based on a Monte Carlo approach which is consistent with solving the Langevin equation in a cubic domain with periodic boundary conditions. Particles irreversibly agglomerate upon collisions.
- What? Both videos represent the same phenomenon with different degrees of zoom to observe the process with different levels of detail. Here we observe the random movement of particles or Brownian motion. We also observe that larger agglomerates tend to move more slowly than smaller ones.
- Why? The Brownian motion is thought to be the result of random collisions between particles and the surrounding gas which result in a force that -as initially proposed by Monsieur Paul Langevin- can be decomposed into a systematic term (drag) and a stochastic term (modeled as Gaussian noise). The latter explains the random movement of particles in this system. This random movement leads to collisions with other particles in random orientations and therefore to the formation of agglomerates. The more time we let the particles interact with each other the bigger agglomerates are. Here I just observed the phenomenon for 1.14 ms because the volume fraction is relatively high (100 ppm) to make the process more visible. For particle formation in flames, such volume fraction is between 3 to 2 orders of magnitude lower so the whole agglomeration process (in the flame) can span up to hundreds of milliseconds. What happens if we keep the process running for an infinite time? Then only one huge agglomerate will exist and this limit is called gelation.
4. First-time passage simulation of agglomerate collisions including rotation
- What? The video below shows two agglomerates of nanoparticles generated using FracVAL. One of them is static (the coordinate system is placed on its center of mass) at the center of a cubic domain and the second is free to wander around. The latter movement is simulated by solving the Langevin equation for both displacement and rotation. This is simulated using my FTP-cpp code. The video ends when both agglomerates collide and therefore agglomeration takes place.
5. The restructuring of a fractal-like agglomerate
- What? The video below shows an agglomerate of nanoparticles generated using FracVAL. In the video, we observe the thermal restructuring of the agglomerate where primary particles start to approach each other and therefore the cluster restructures to a more compact shape that at the end of the process becomes spherical-like. Particles interact via Lennard-Jones potentials and their dynamics are simulated by solving the Langevin equation.
- Why? It is reasonable to think that the structural stability of an agglomerate of nanoparticles is determined by the predominance of primary particles binding energy over thermal energy. As we increase temperature the thermal energy becomes more important than binding energy (primary particles start to vibrate more) and consequently the structure of the aggregates is restructured. In addition, some works in the literature have shown a systematic reduction of aggregate sizes as temperature increases. For particles such as silica, titania, or metallic this may be explained by sintering where mass transfer between primary particles takes place leading to a reduction in the size of the aggregate. However, for other particles such as black carbon, we think that sintering may not exist (at least under flame conditions) because their melting temperature is too high, and therefore the reduction in aggregate size with temperature such as the one observed in this work may not be sintering but thermal restructuring! This work is currently under review.
6. Fragmentation of a fractal-like agglomerate
- What? The video shows the thermal fragmentation of a fractal-like agglomerate due to binding energy between primary particles being in the same order of magnitude as thermal energy. The agglomerate was generated using FracVAL and here we simulate the primary particle motion by solving the Langevin equation considering bonded Harmonic potential interaction between monomers. This work is currently under review.
7. Realistic flame-made agglomerates of nanoparticles simulated numerically
- How? The figure below shows a total of four different numerical TEM (transmission electron microscopy) images of agglomerates of soot particles simulated using MCAC for 30 ms under pure agglomeration (blue frame) and agglomeration and surface growth (red, yellow and green frames). These images correspond to the simulations published in this paper.
- What? We observe clearly different agglomerates between pure agglomeration and agglomeration+surface growth. We also observe some degree of overlapping between primary particles when surface growth is included.
- Why? When pure agglomeration takes place, then primary particles will be in a single point contact (as we thus model it). However, when surface growth is added some mass will continuously be added on particle surfaces and therefore the zone of point contact will become an “overlapped” zone explaining the different morphologies observed below. In addition, the surface growth will modify the particle dynamics and thus the particle-particle interaction regime.

8. Light-scattering from particles in a flame
- What? The image below shows the measured light-scattering intensity at an angle of 14.9° of particles from a flame when irradiated with a 532 nm wavelength horizontal plane laser. We observe that intensity evolves in almost 4 orders of magnitude between the zones where the particles are located compared to the scattering from the gas molecules. See this paper for further details.

9. No wings?
- What? The image below shows an unexpected surprise we found when I measured the volume fraction of soot in an n-heptane diffusion flame using the line-of-sight attenuation technique. As shown on the left panel provided by Mr. Alejandro Jerez, the soot volume fraction field we were used to measure typically shows a peak of particle concentration in what we call the “wings” of the flame corresponding to a radial location that approaches the burner fuel exit tube at lower height above the burner but approaches to the centerline for higher positions in the flame. However, as shown on the right panel of this figure, the n-heptane doped with methane and combusted in air diffusion flame does not show wings! For some reason, we do not understand, that soot particles are concentrated only near the centerline of the flame. These measurements correspond to this paper.